 Forefront
Creating Dashboards in Forefront
How to create dashboards in Forefront, with examples.
Dashboards bring several reports together on one page so teachers and leaders can keep an eye on their data over time. Besides reports, a dashboard can hold guiding questions for PLC, MTSS or other data meetings, links to district resources, images, and text that updates to show the group of students being viewed. This article walks through building a dashboard: creating it, adding report tiles, choosing assessments and cohorts, adjusting the display, adding text, and saving.
Dashboards vs. saved reports: when to use each
Saved reports hold a single report you want to keep and share, such as a handout for a PLC meeting or a growth comparison between two assessments.
Dashboards group multiple reports in one place for ongoing monitoring.
Keep the number of dashboards small. When there are too many, the key information gets harder to find.
Key terms
Tile (widget): A block on the dashboard grid, such as a report, a text box or an image.
Entity: What a report measures: standards, an overall assessment, the items (questions) on an assessment, or report card standards.
Cohort: Who a report covers: a class, course/school, grade, student, the whole district (Global) or a saved cohort.
Dynamic cohort: A cohort that changes depending on who is looking at the dashboard. With a Dynamic Class, each teacher sees results for their own class instead of everyone seeing the same class. A dynamic school or district works the same way, so a school-based dashboard shows each building team its own students.
Step 1: Create a new dashboard
Go to Resources.
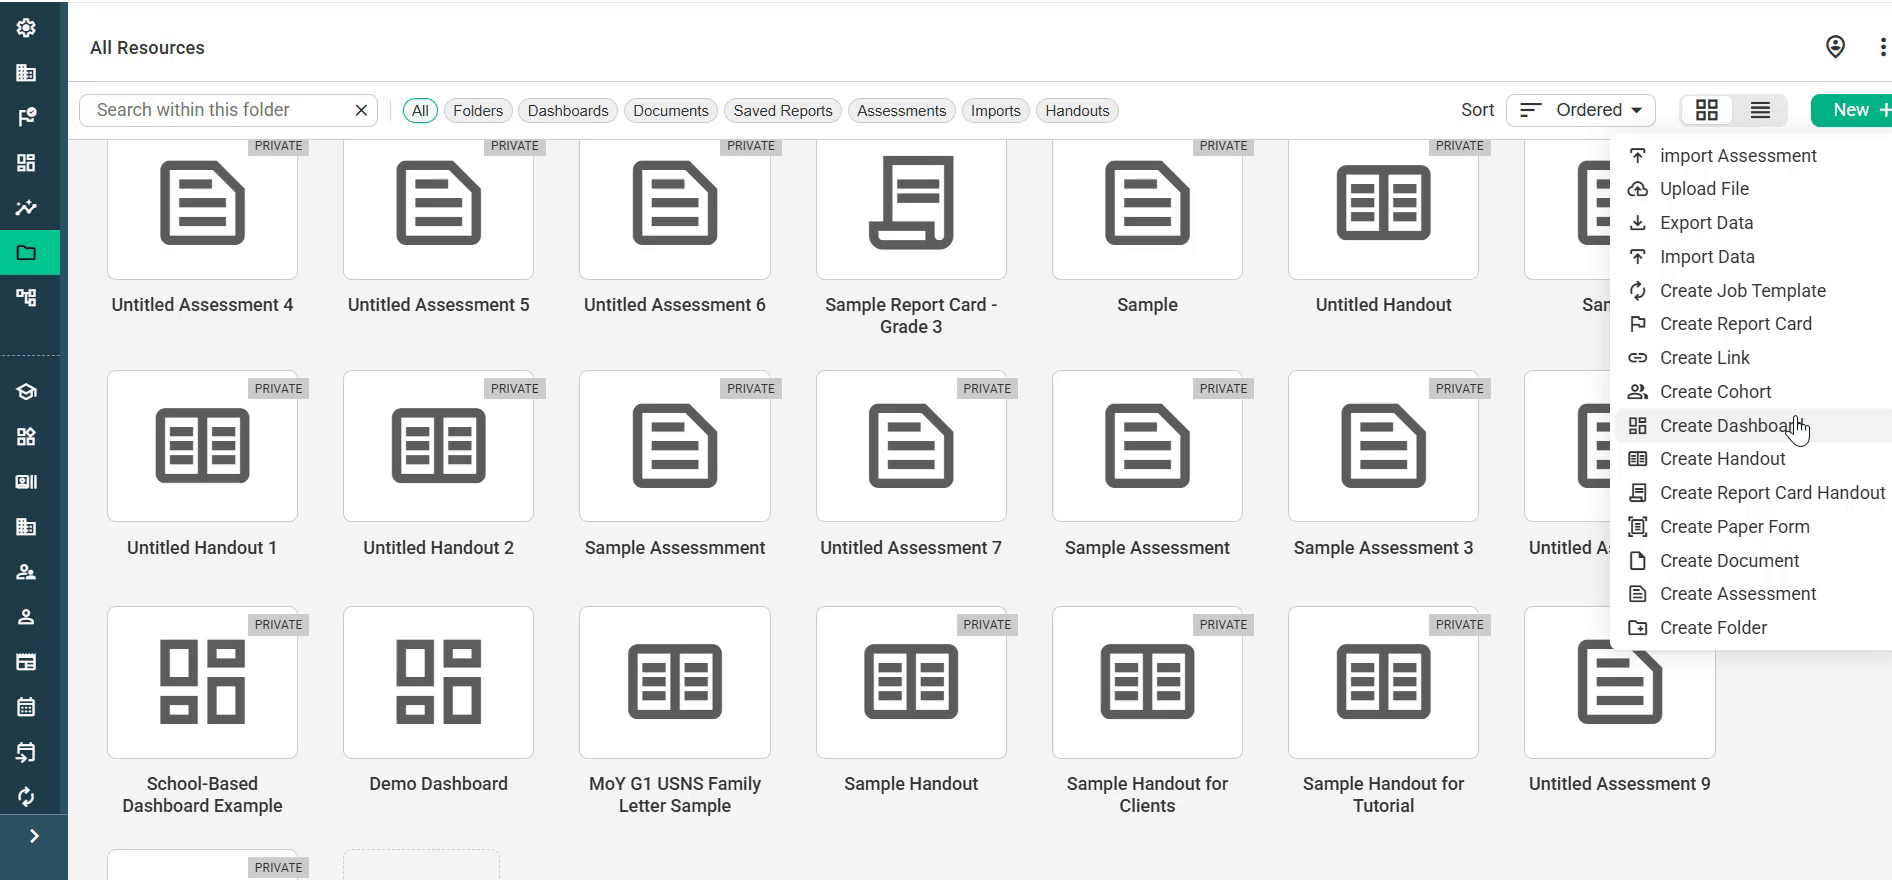
Click New + in the top-right corner and choose Create Dashboard.
Type a name for your dashboard and click Create Dashboard.
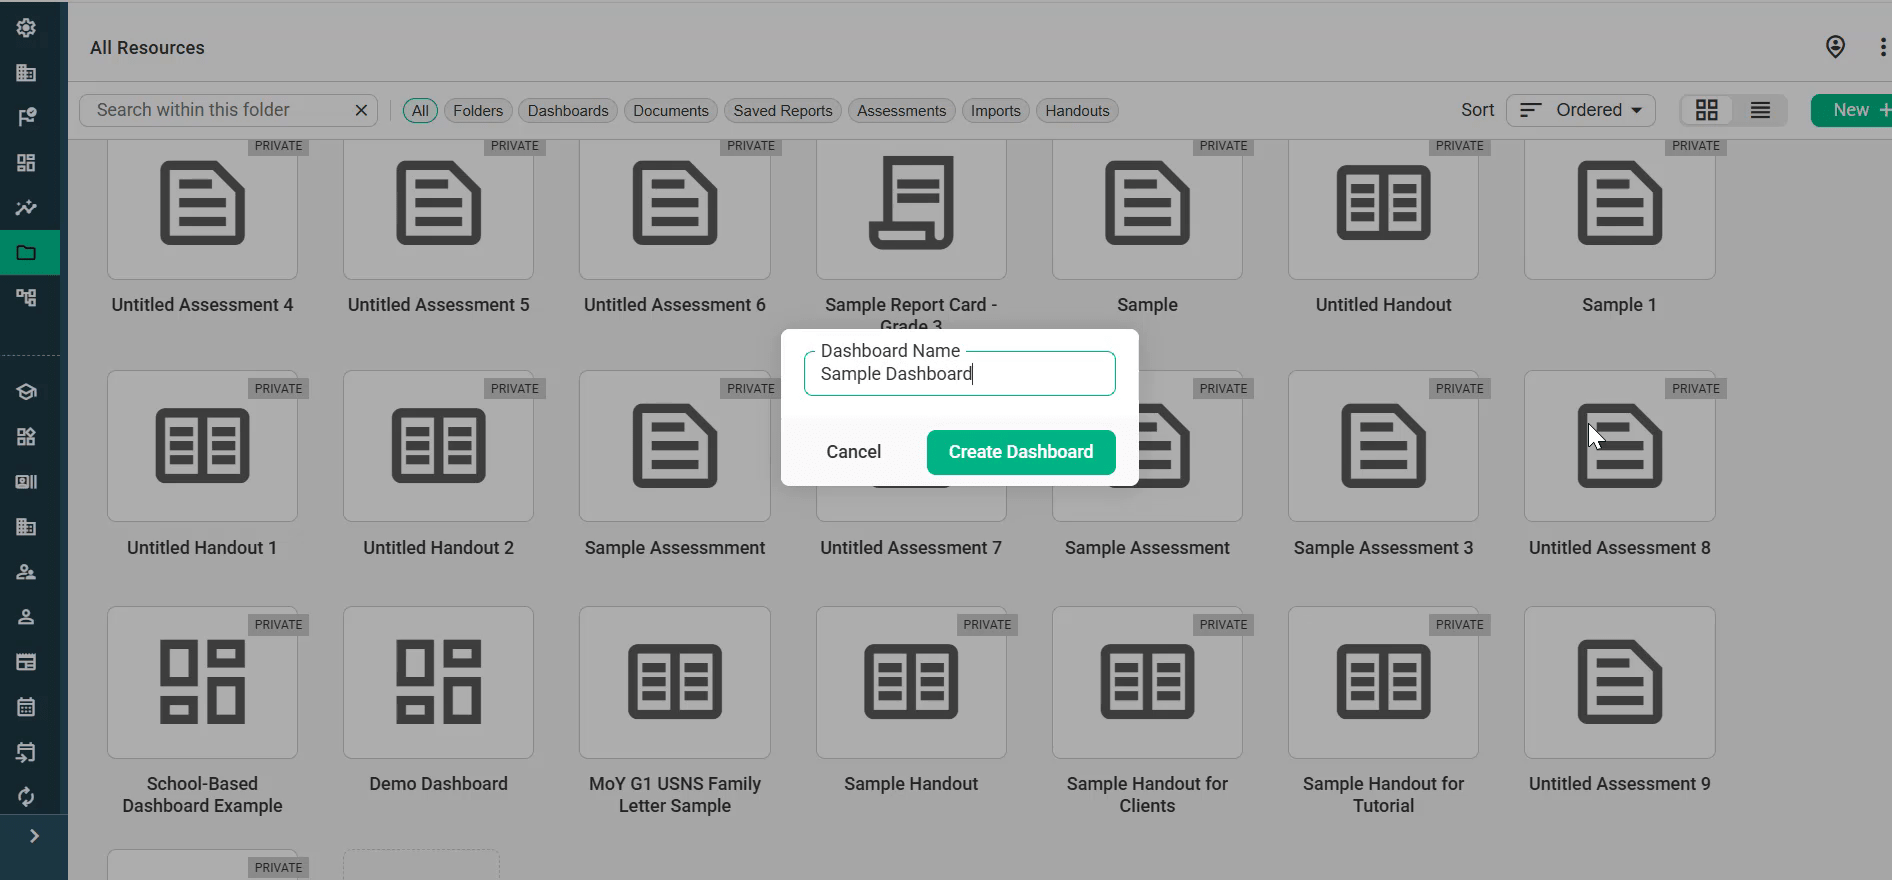
The dashboard opens in the editor. New dashboards start out Private, shown by the label next to the name at the top of the page.
Step 2: Get to know the editor
Canvas (left): The grid where you place and arrange tiles.
Side panel (right): It has three tabs:
Widgets: The tiles you can add: Report, Text, Image, Cohort Name and Saved Report.
Cohorts: Preview the dashboard with a specific class (see Step 6).
Active Widget: The settings for the selected tile. This tab appears once you select a tile.
Top bar: Save, Publish, and a button that shows or hides the side panel.
Step 3: Add a report tile
Report tiles work the same way as the Forefront reporting suite. You decide what to look at (entities) and which students to look at (cohorts), and then choose a visualization, either first or after the report is set up.
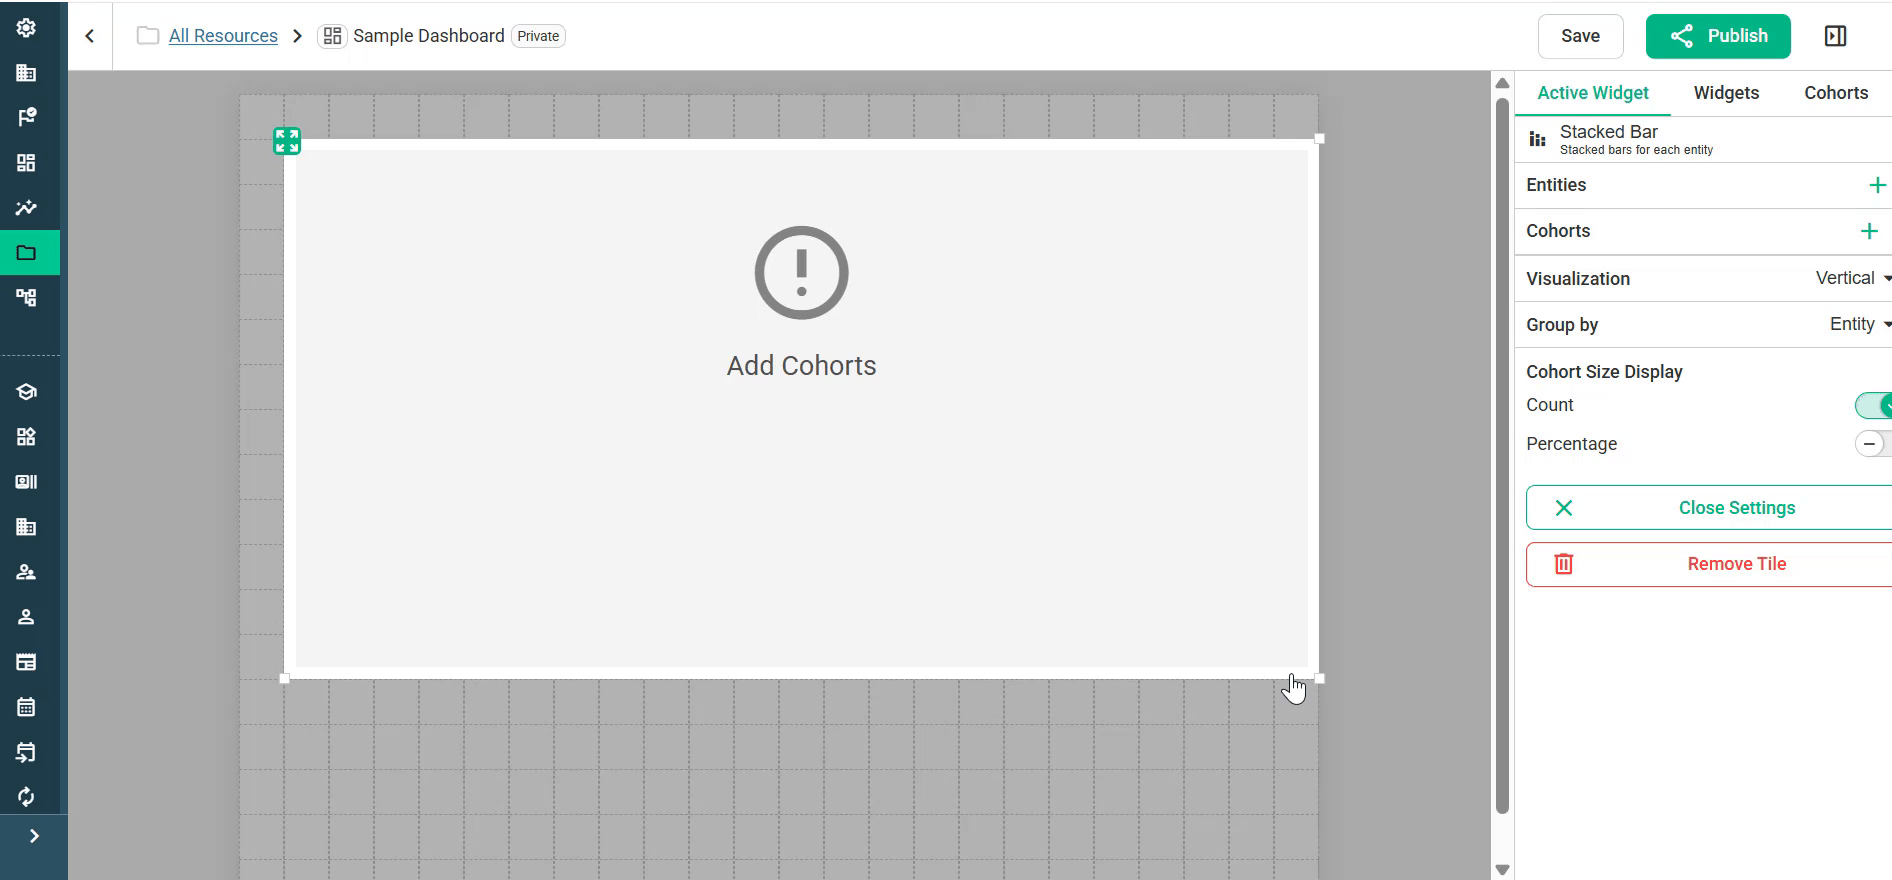
On the Widgets tab, drag Report onto the grid.
Resize the tile by dragging its bottom-right corner. Move it by dragging the handle in its top-left corner.
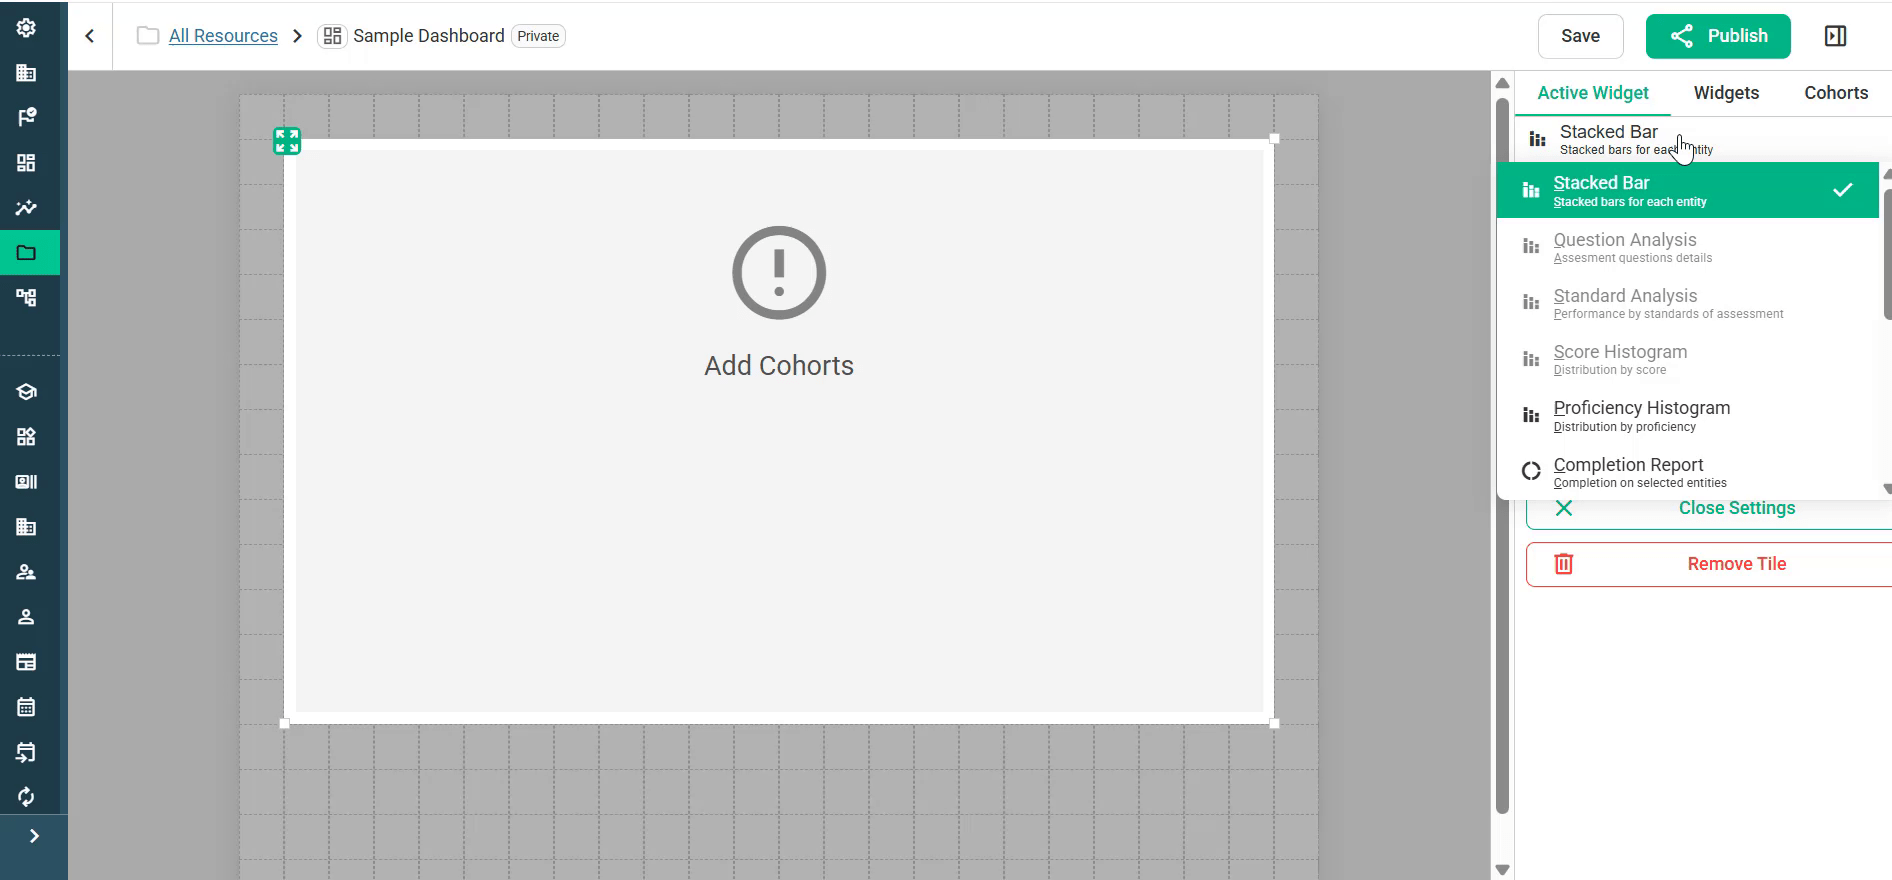
At the top of the Active Widget tab, open the dropdown and choose a report type:
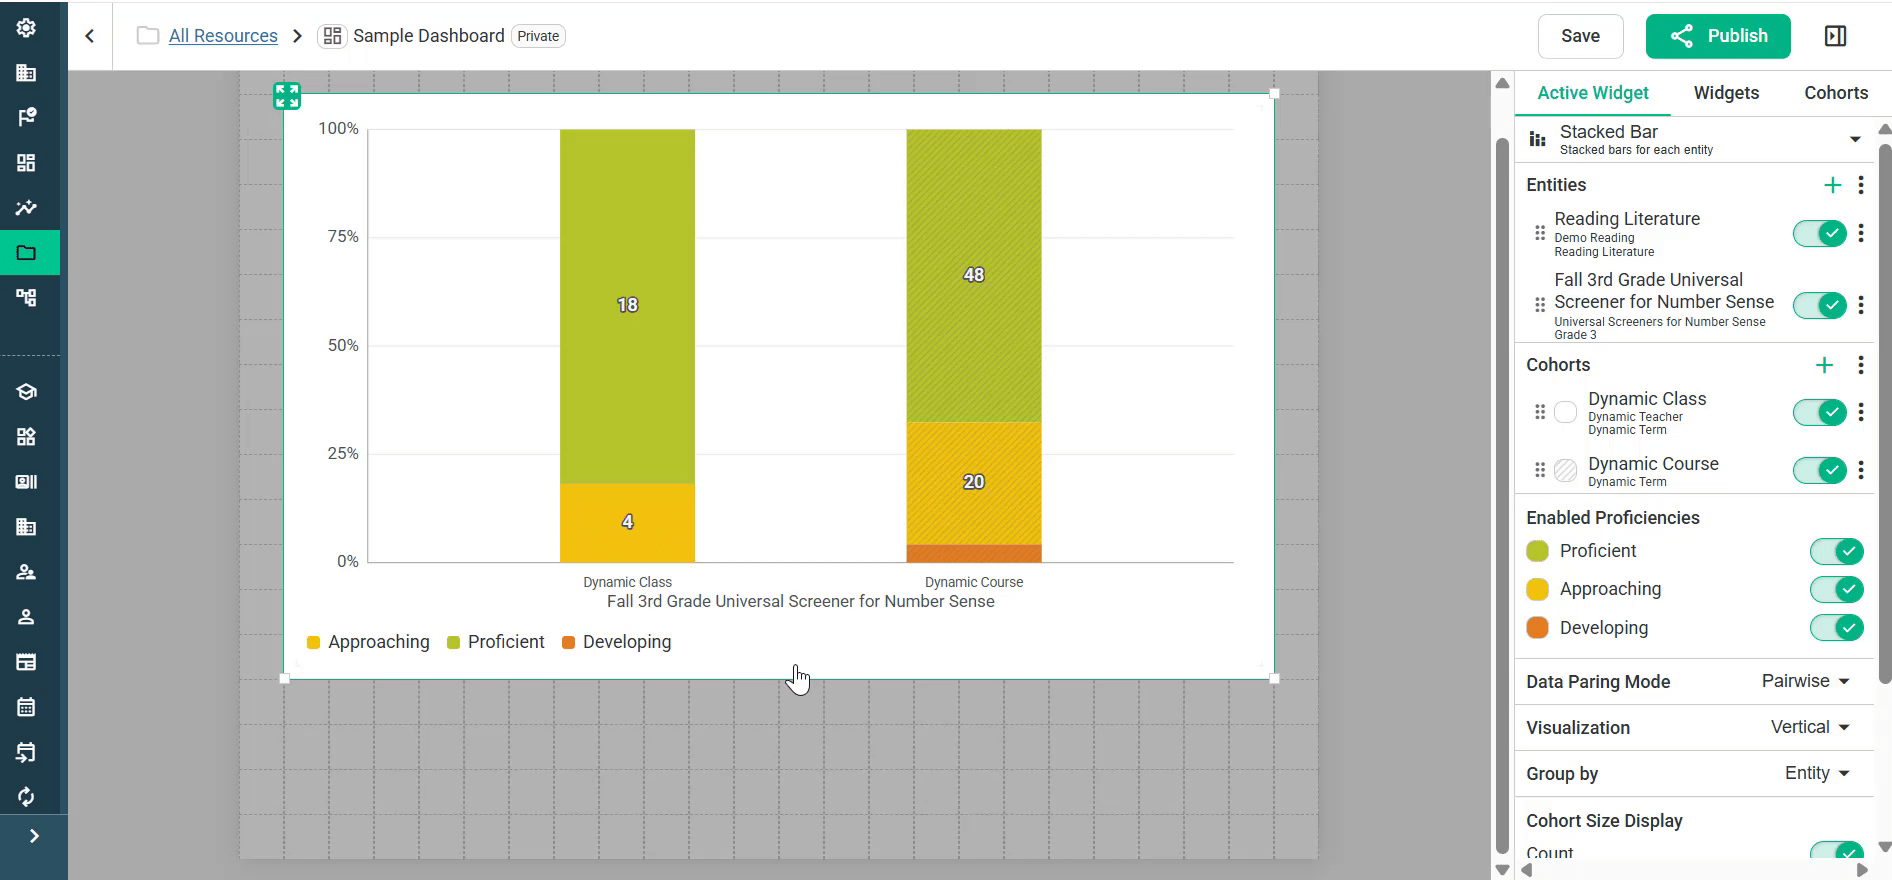
Stacked Bar: Stacked bars for each entity
Question Analysis: Details for each assessment question
Standard Analysis: Performance by the standards on an assessment
Score Histogram: Distribution by score
Proficiency Histogram: Distribution by proficiency level
Completion Report: Completion for the selected entities
Some report types are grayed out (“Assessment Entity Required”) until you add an assessment in Step 4.
Step 4: Add entities (what to report on)
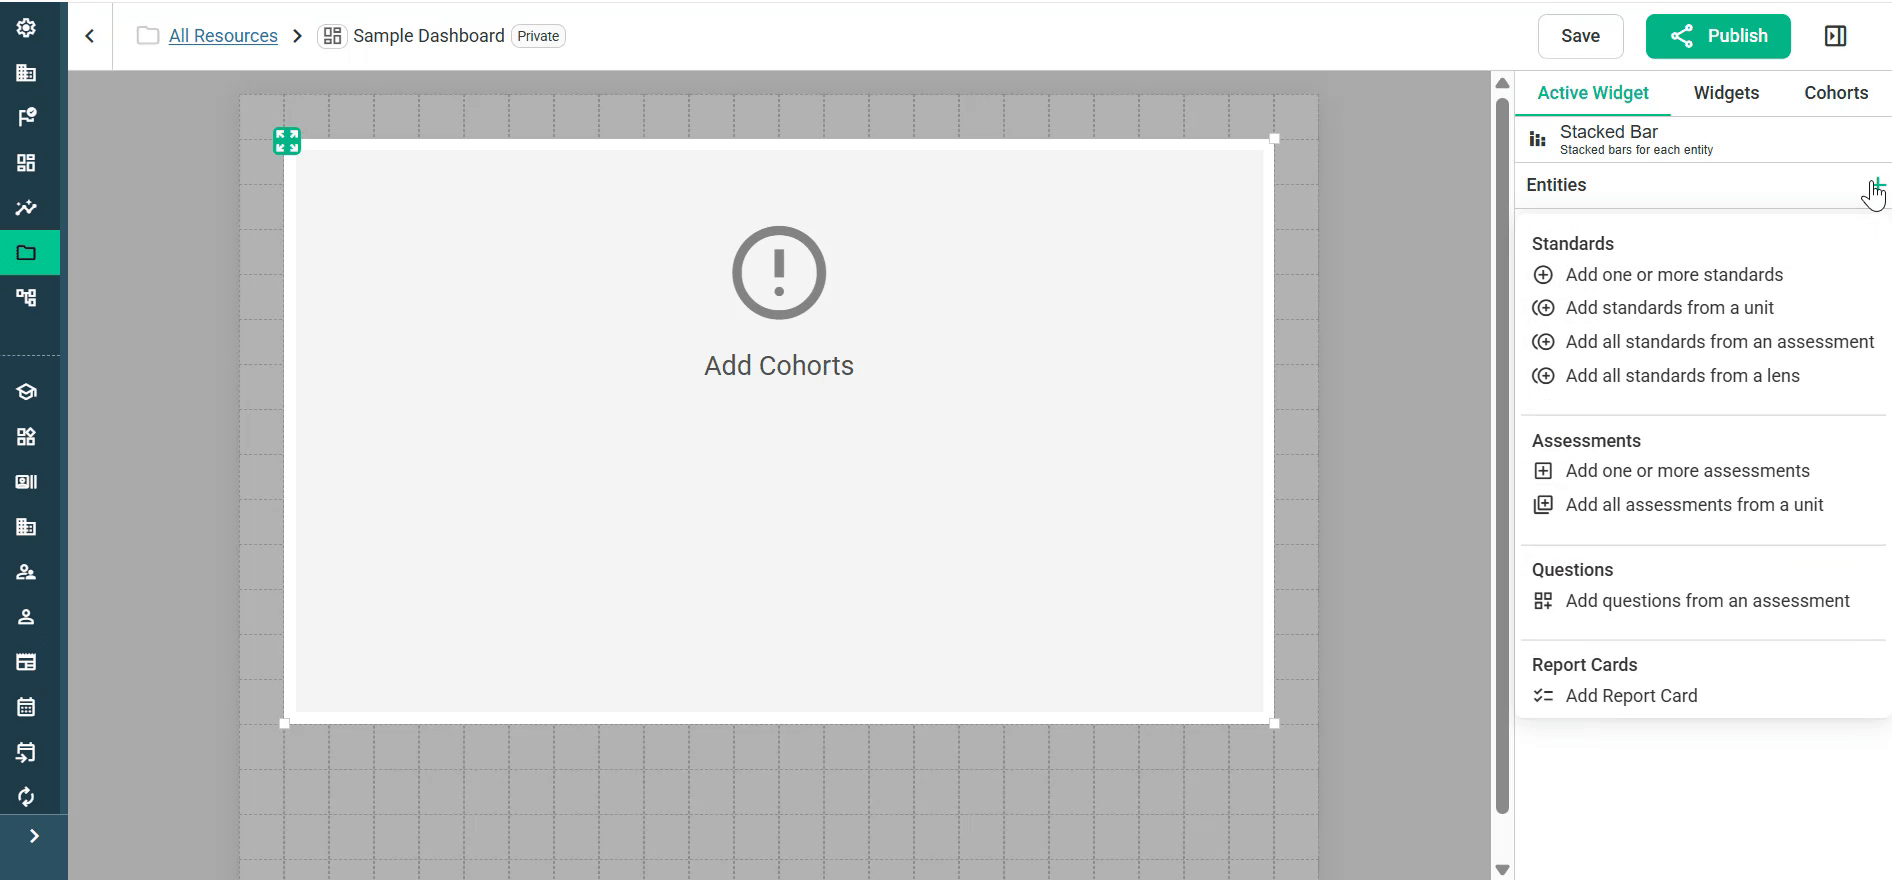
Click + next to Entities.
Choose what to add:
Standards: Add one or more standards, standards from a unit, all standards from an assessment, or all standards from a lens.
Assessments: Add one or more assessments, or all assessments from a unit.
Questions: Add questions from an assessment.
Report Cards: Add a report card.
In the selection window, open folders to find your item, check its box and click Select.
You can add more than one entity to a tile. Each entity has a toggle for turning it on or off without removing it. The ⋮ menu next to Entities has these options:
Enable All Entities
Remove Disabled Entities
Hide entities with no data
Step 5: Add cohorts (who to report on)
Click + next to Cohorts.
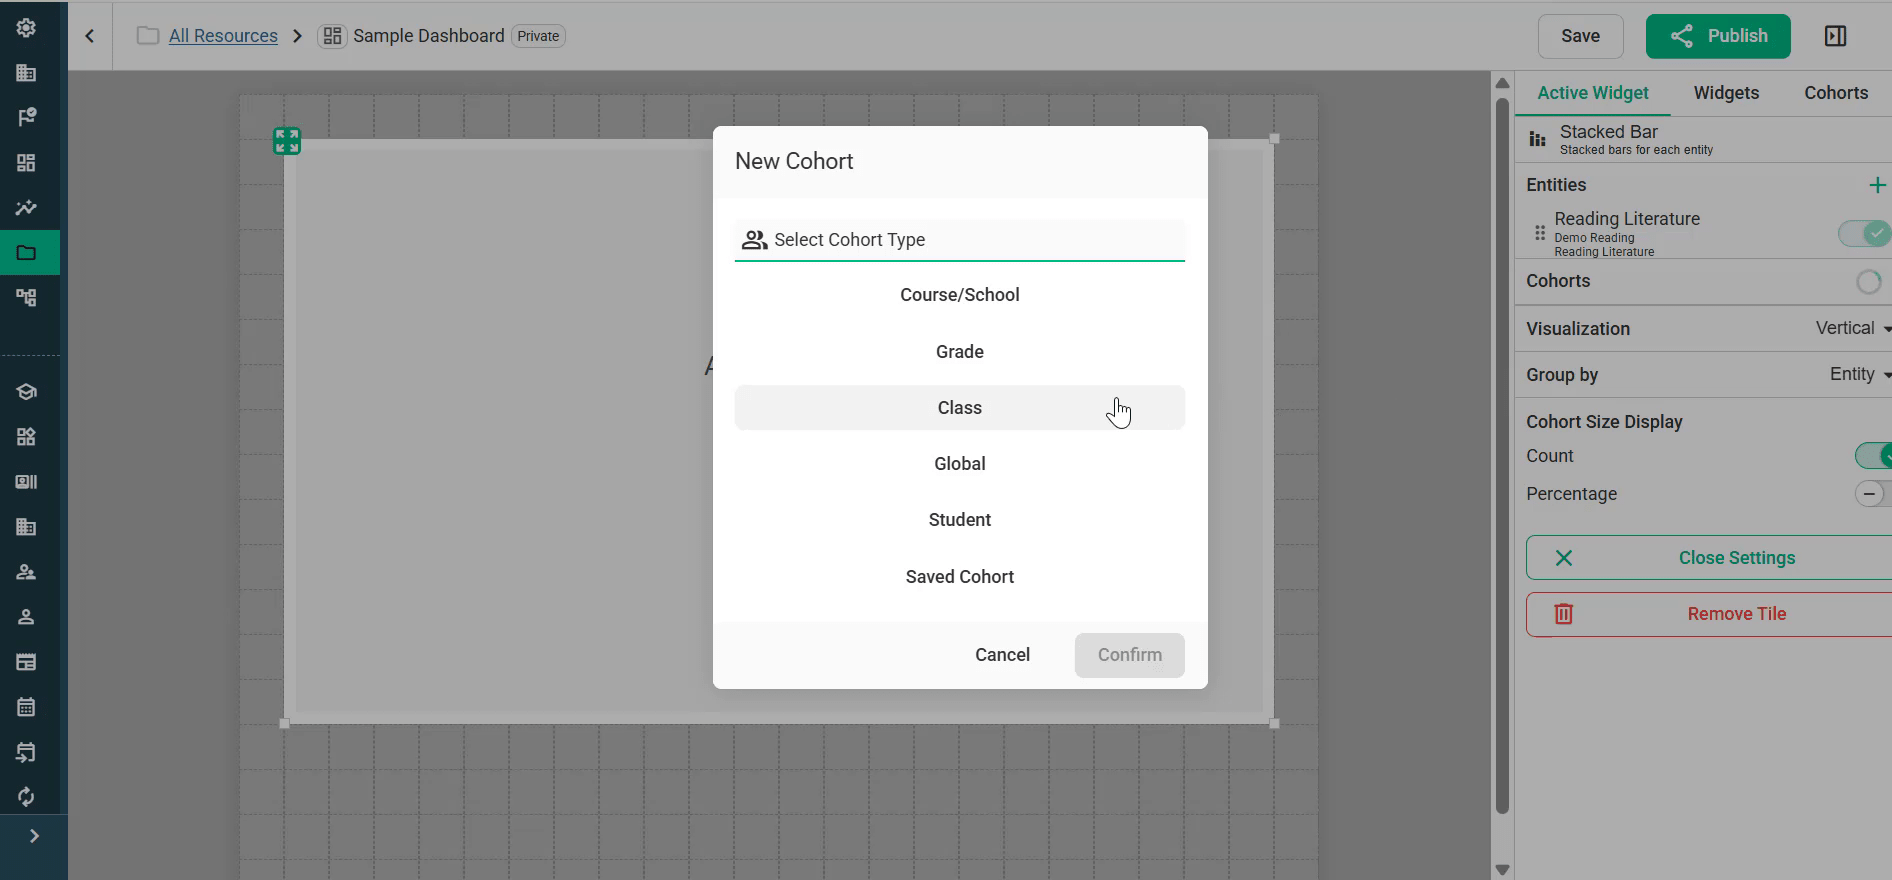
In the New Cohort window, choose a cohort type: Course/School, Grade, Class, Global, Student or Saved Cohort.
Set up the cohort and click Confirm.
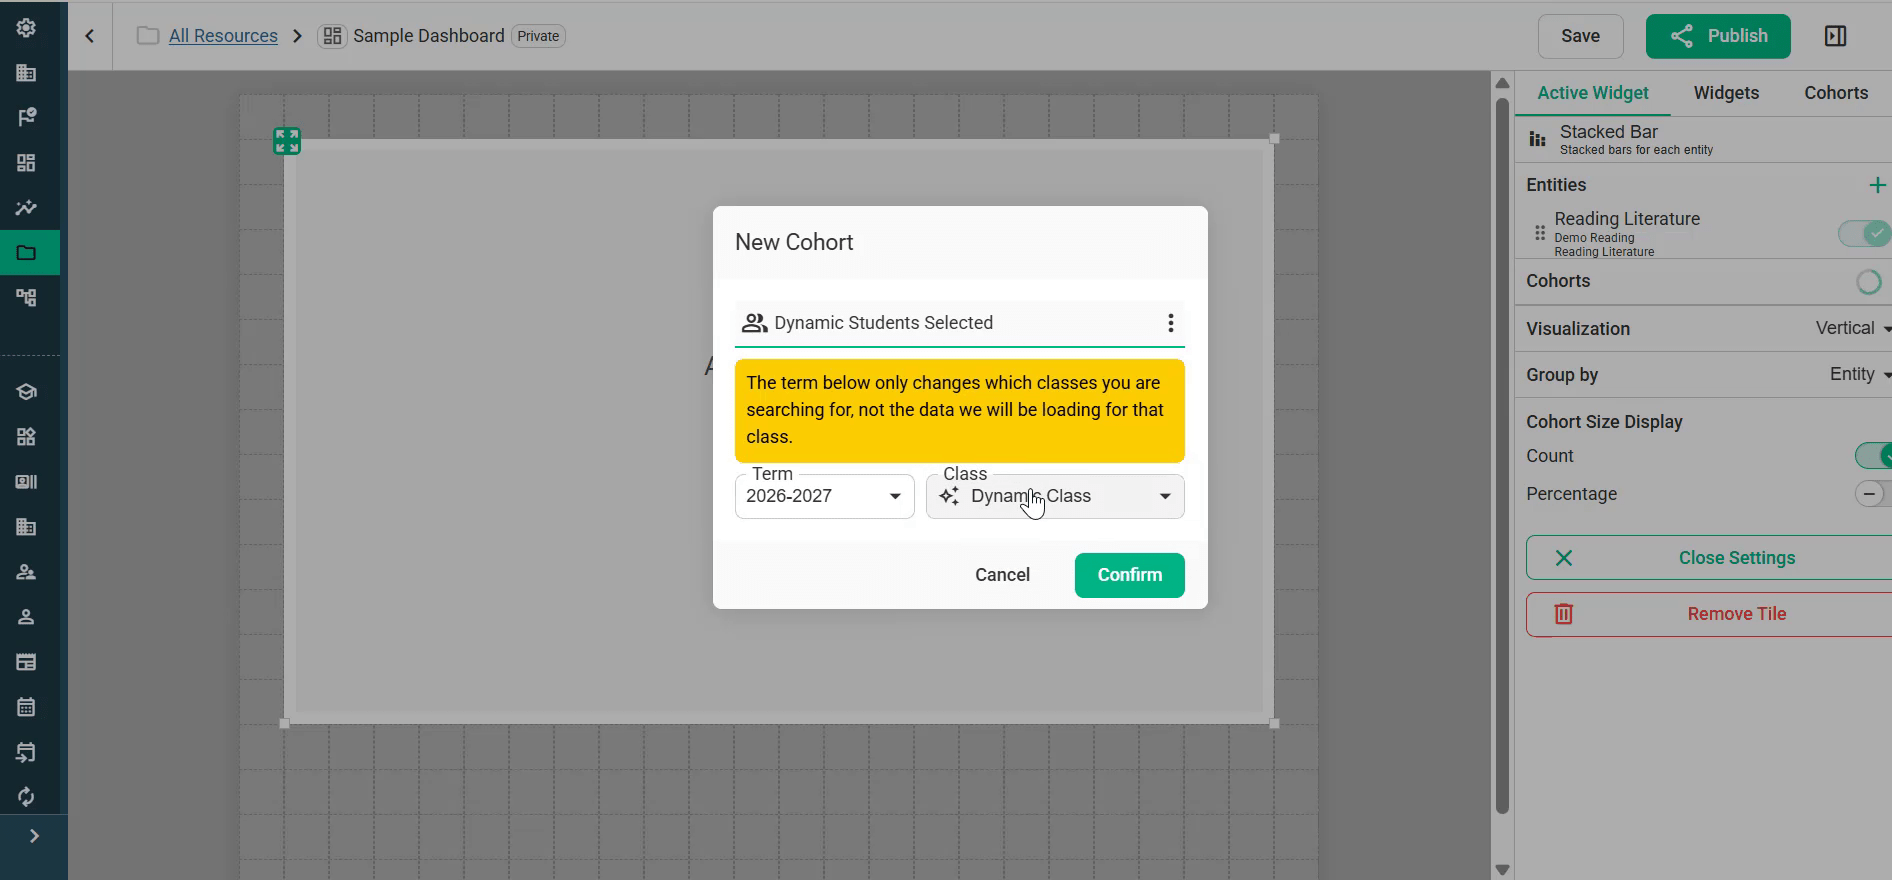
In most cases, choose a dynamic cohort so that each person sees data for their own students. For example, if you want every third-grade teacher to see their own class’s results on an assessment, use a Dynamic Class.
Dynamic Class: Choose Class, then choose Dynamic Class from the Class dropdown. The Term field only changes which classes you can search. It does not change the data that loads.
Dynamic Course: Choose Course/School, then set Course to Dynamic Course, Term to Dynamic and School to All Schools (or a specific school).
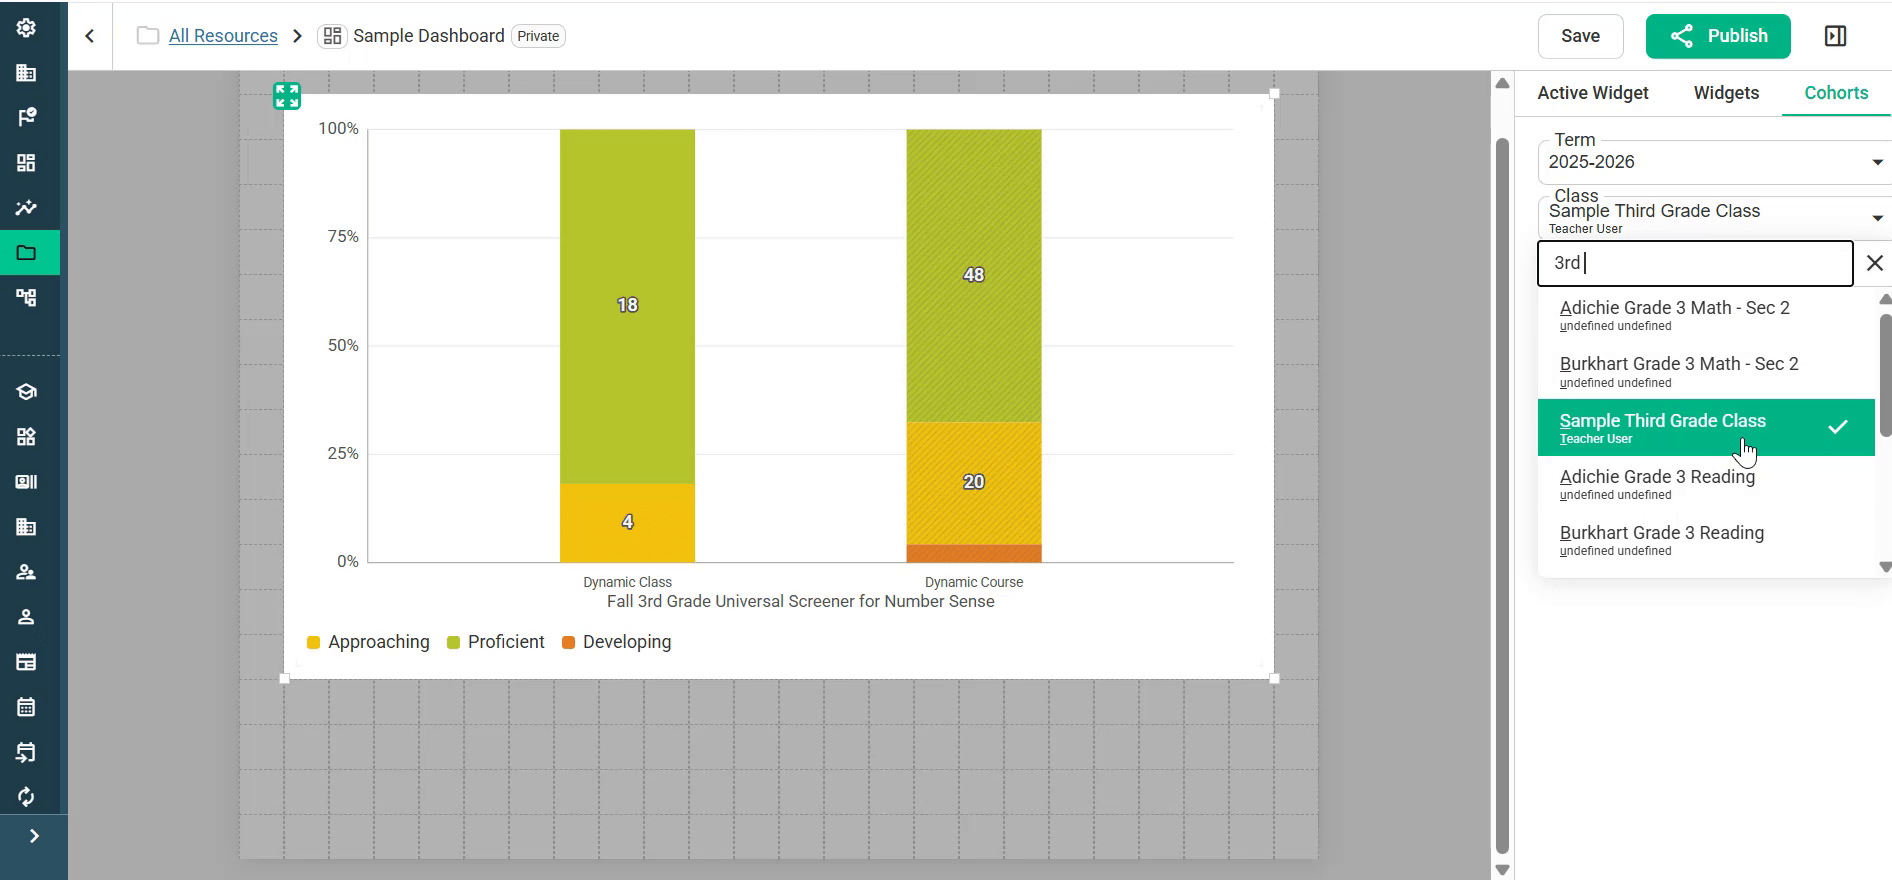
Tip: You can add more than one cohort to a tile. Add a Dynamic Class cohort and a Dynamic Course cohort (Dynamic Term) to show a teacher’s students side by side with students in the same course at their school.
With dynamic cohorts, the tile shows Configure Dynamic Cohorts until you pick a class to preview (Step 6).
Step 6: Preview your dashboard with the Cohorts tab
Dynamic cohorts fill in when someone views the dashboard. To see real data while you build:
Open the Cohorts tab in the side panel.
Choose a Term.
Search for a Class and select it.
The tiles update to show results for that class, so you can check that the dashboard looks the way you want. This is only a preview. Viewers still see their own students.
Step 7: Adjust display settings
Select a report tile to open its settings on the Active Widget tab:
Enabled Proficiencies: Turn proficiency levels (for example Proficient, Approaching and Developing) on or off.
Data Pairing Mode: Controls how entities are matched with cohorts.
Pairwise (default): Each cohort is shown for each entity.
Lockstep: Entities and cohorts are paired in order: the first entity with the first cohort, the second with the second, and so on. This is useful for showing several grade levels in one report. For example, put a kindergarten screener with a kindergarten cohort and a first-grade screener with a first-grade cohort, then drag the entities and cohorts so they line up in the same order. See Reporting Suite: Quick Videos.
Merge: combine results into one aggregate column.
Visualization: Vertical, Horizontal or Pie Chart.
Group by: How bars are grouped (for example by Entity).
Cohort Size Display: Show student Count, Percentage or both.
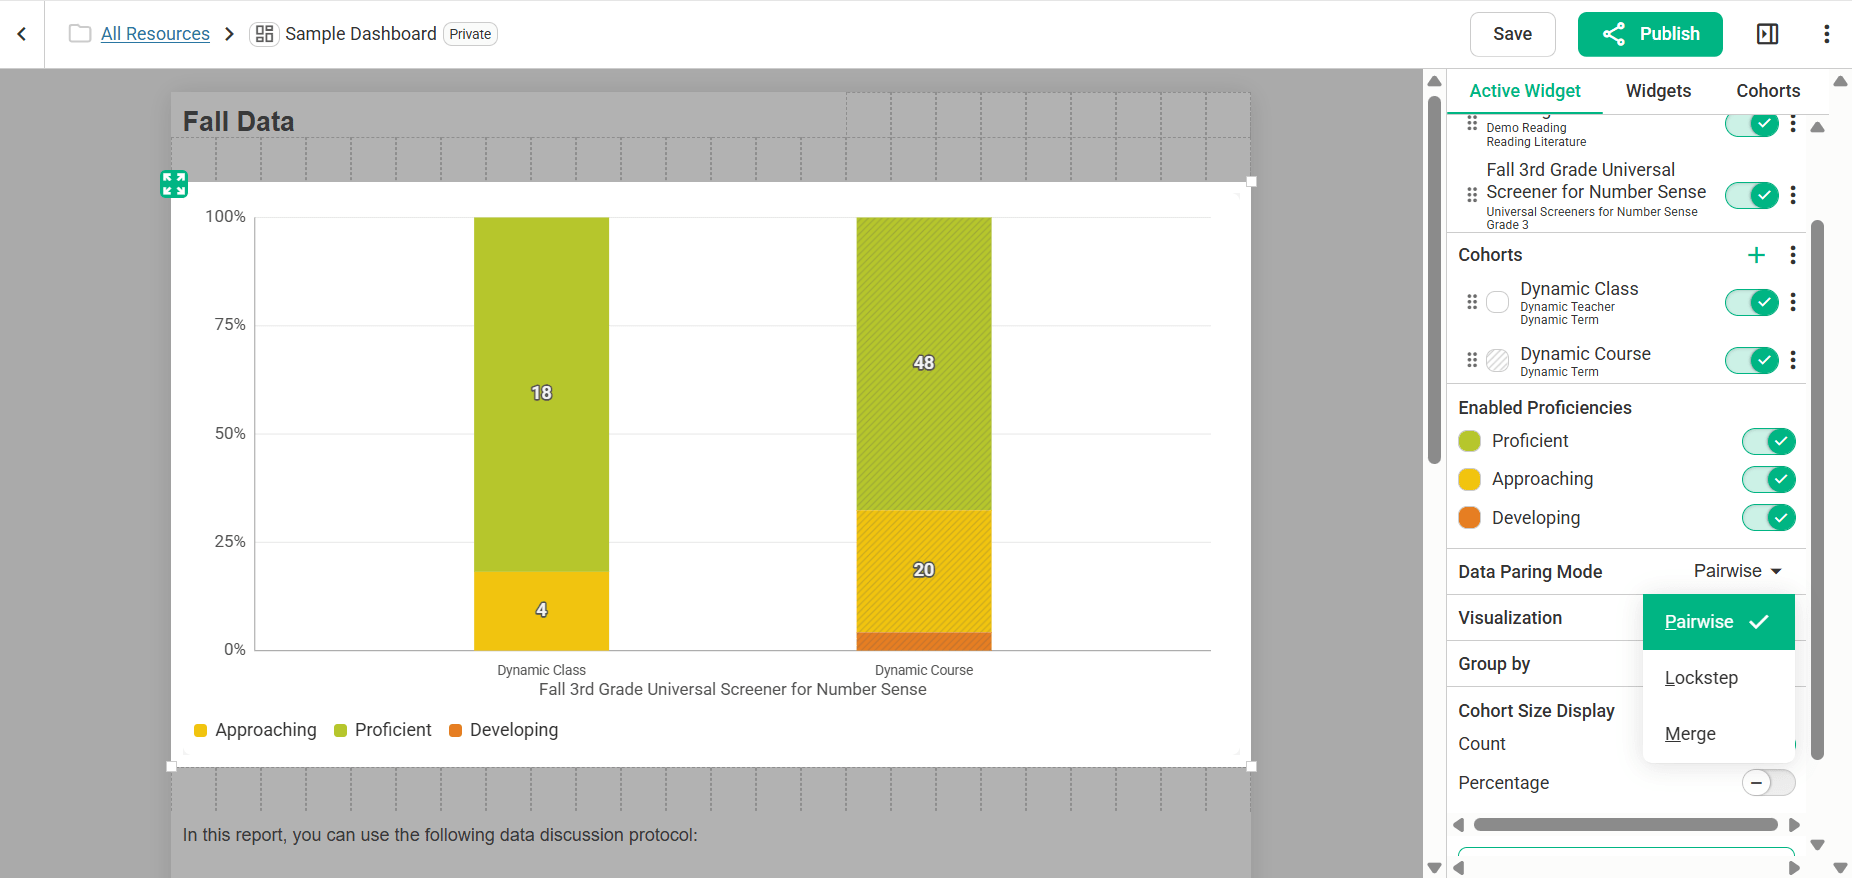
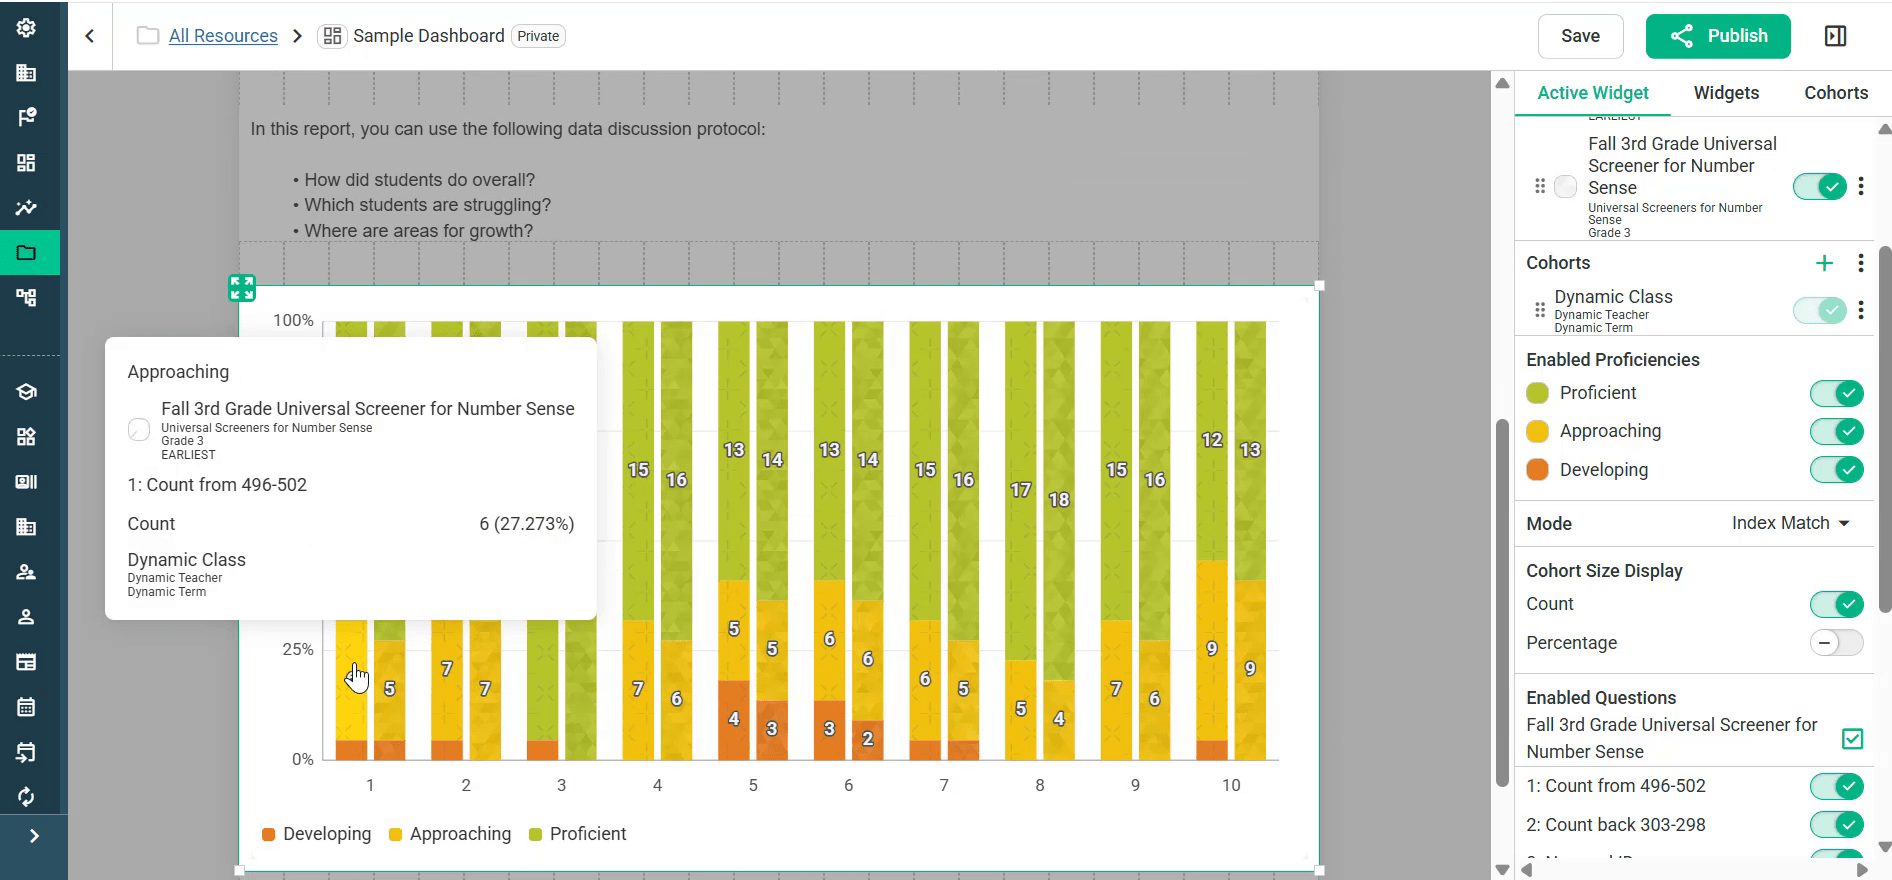
Hover over any part of a chart to see its details, including the count and percentage of students.
Step 8: Fine-tune an entity
Each entity has its own ⋮ menu with these options: Move Up, Move Down, Edit Entity, Focus Entity, Clone, Add Questions and Remove.
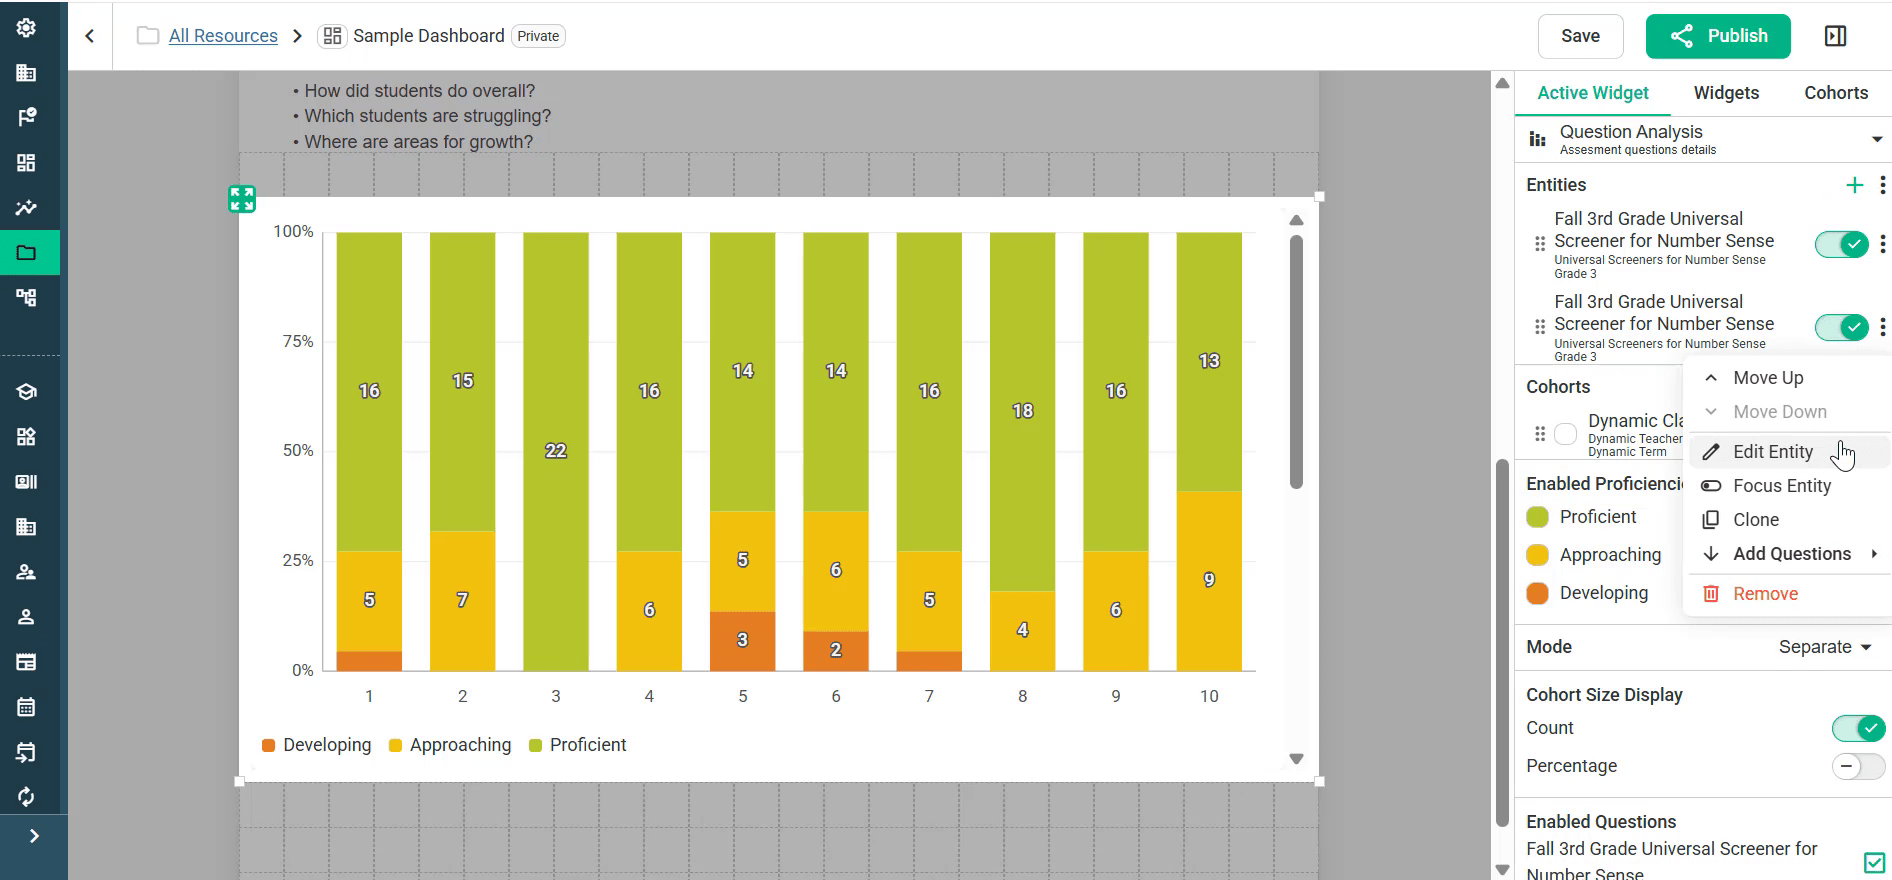
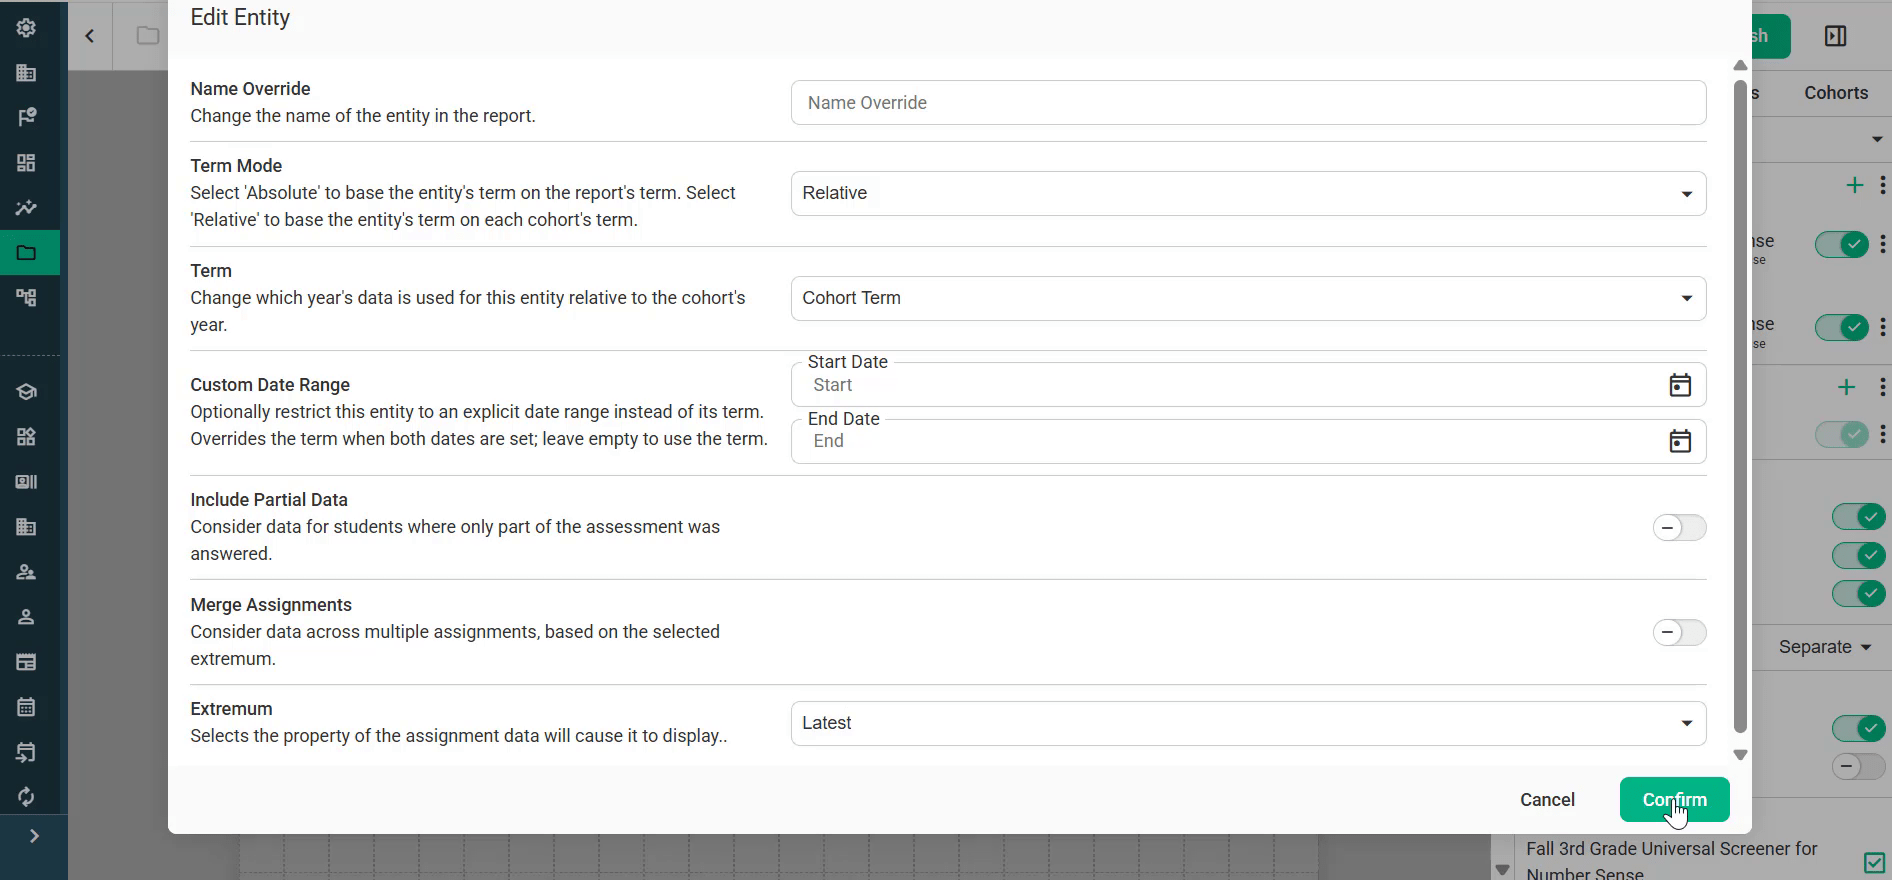
Choose Edit Entity to change these settings:
Name Override: Change the name of the entity in the report.
Term Mode: Choose Absolute to base the entity’s term on the report’s term, or Relative to base it on each cohort’s term.
Term: Choose which year’s data to use, relative to the cohort’s year.
Custom Date Range: Limit the entity to specific start and end dates. When both dates are set, they override the term.
Include Partial Data: Include students who answered only part of the assessment.
Merge Assignments: Combine data across multiple assignments, based on the Extremum setting.
Extremum: Choose which attempt to show, such as Latest or Earliest.
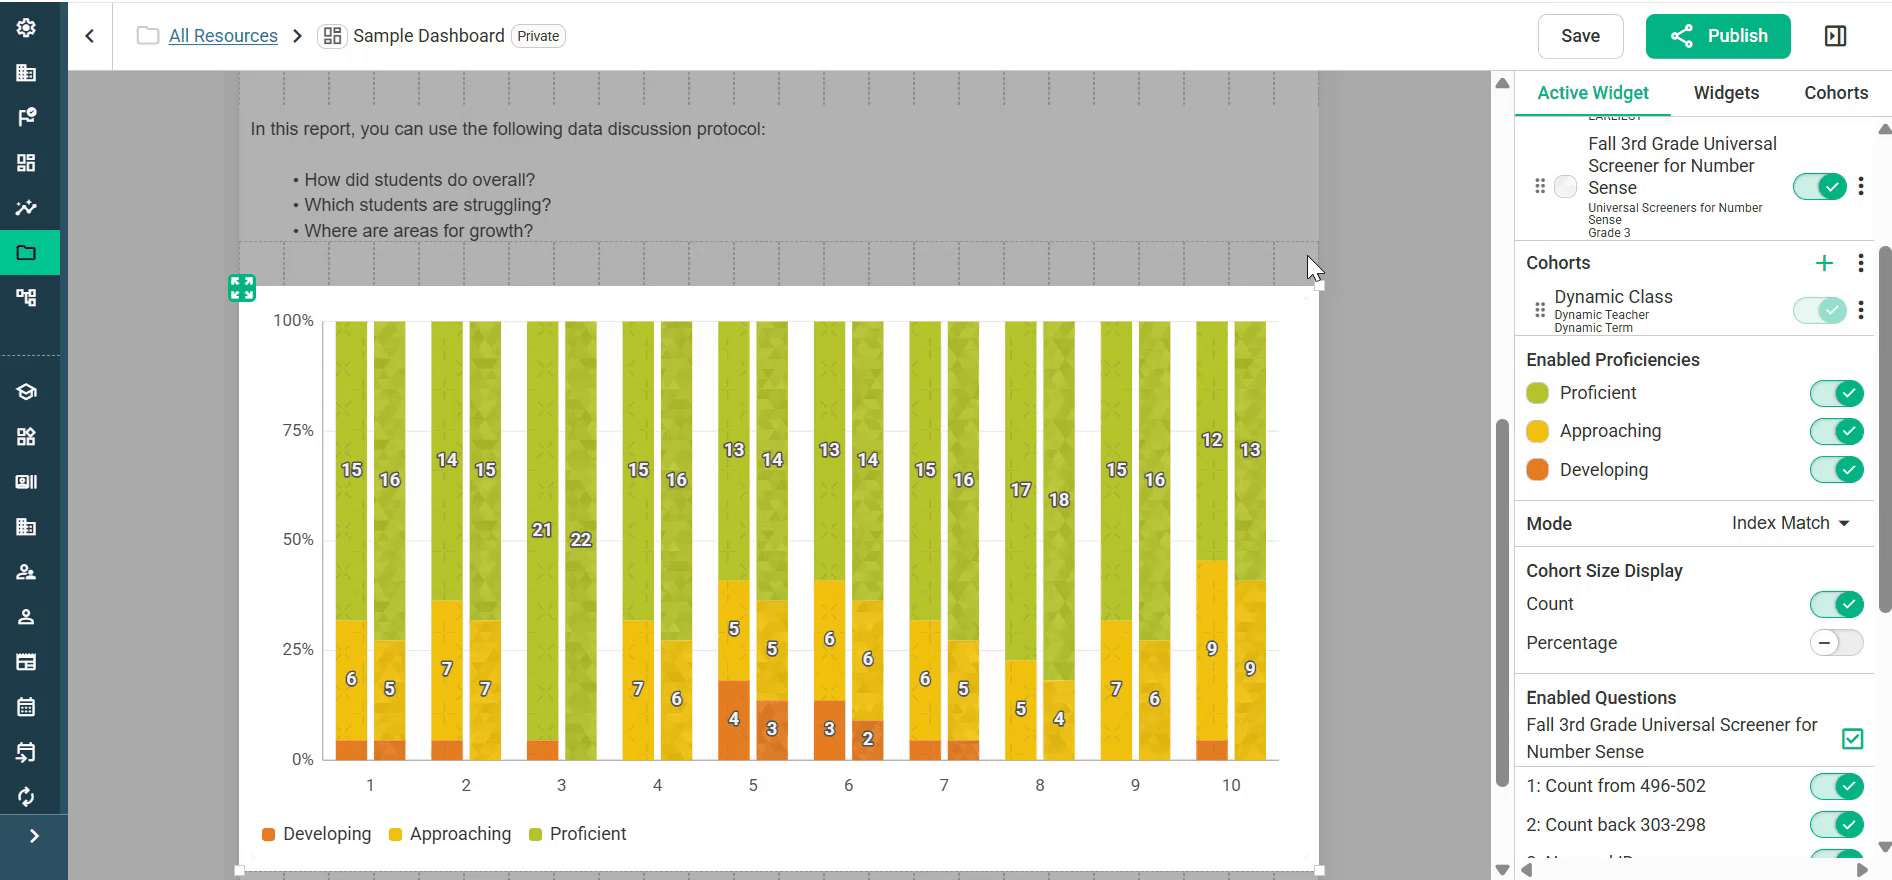
Example: compare earliest and latest results. This works well when you use the same assessment to monitor progress over time. On a Question Analysis tile, Clone the assessment entity. Leave one copy on Latest (the default) and set the other copy’s Extremum to Earliest. Then switch Mode to Index Match. Each question now shows the earliest and latest results side by side. Question Analysis tiles also have an Enabled Questions list for showing or hiding individual questions.
Step 9: Add text, images and other tiles
Drag any of these from the Widgets tab:
Text: Add titles (for example a bold “Fall Data” heading), guiding questions for PLC, MTSS or other data meetings, notes on what insights to look for in the reports, or links to district resources. The toolbar has options for headings, bold, lists, alignment, links and more.
Image: Add a picture or graphic.
Cohort Name: Dynamic text that fills in with the group of students being viewed, such as a district, a grade level, or a grade level at one school.
Saved Report: Place an existing saved report on the dashboard. We generally recommend building reports inside the dashboard instead, so they stay dynamic and carry over more smoothly from one school year to the next.
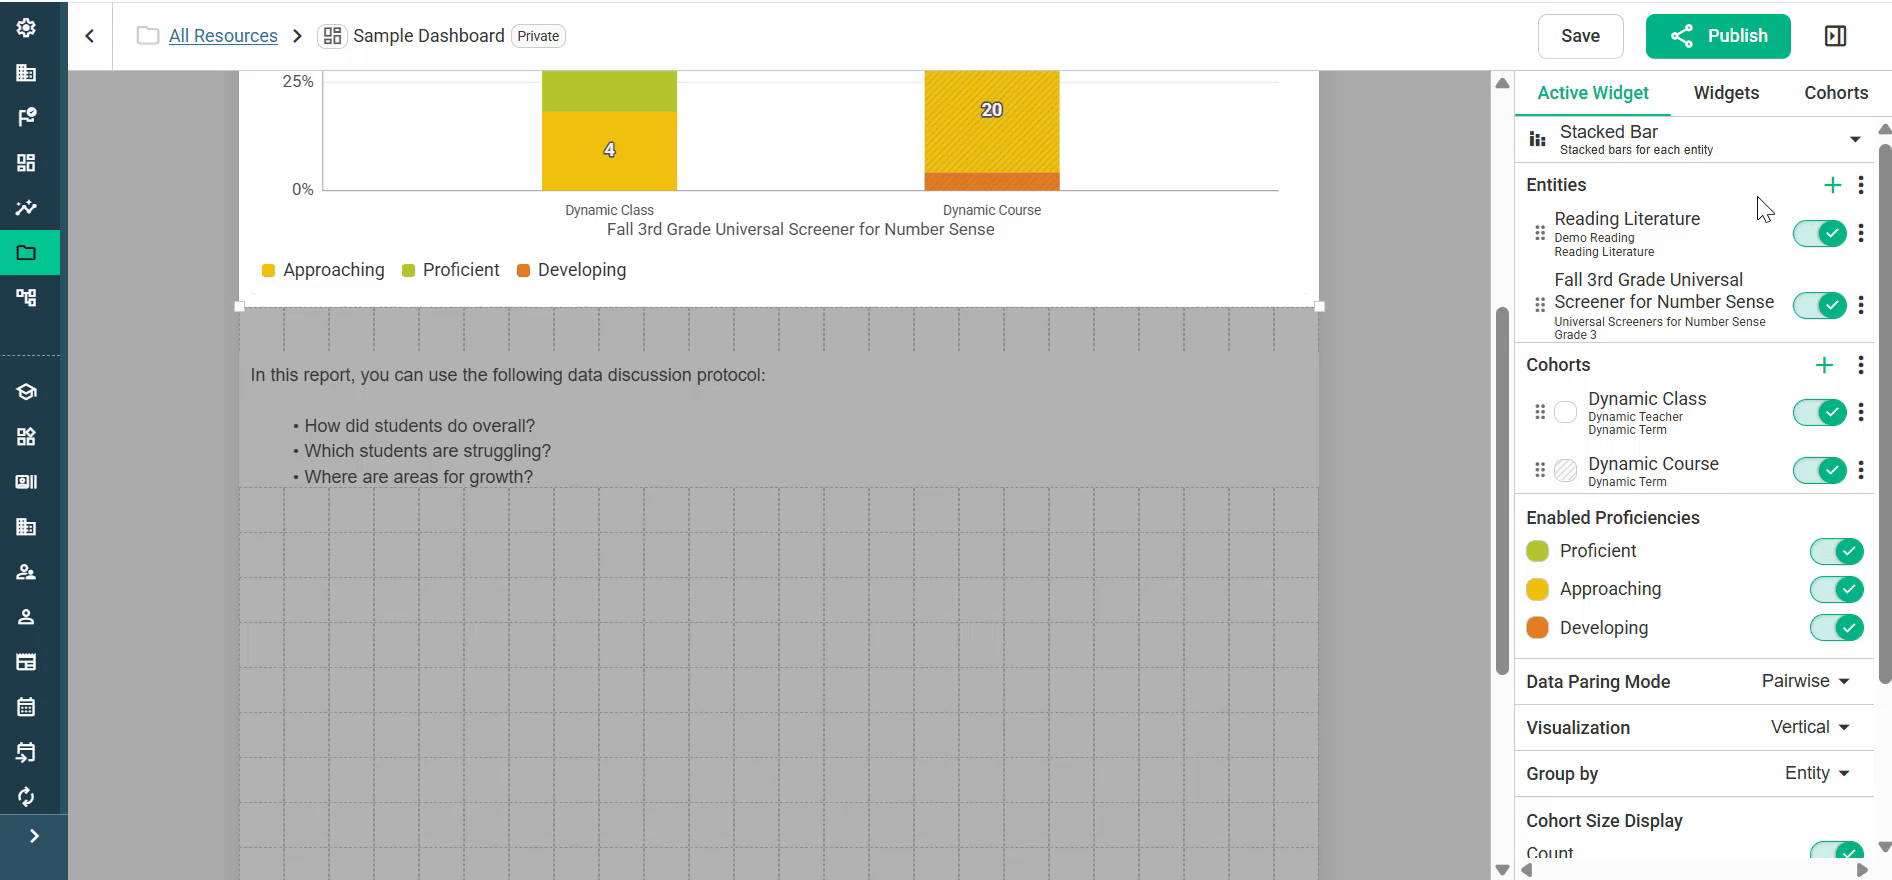
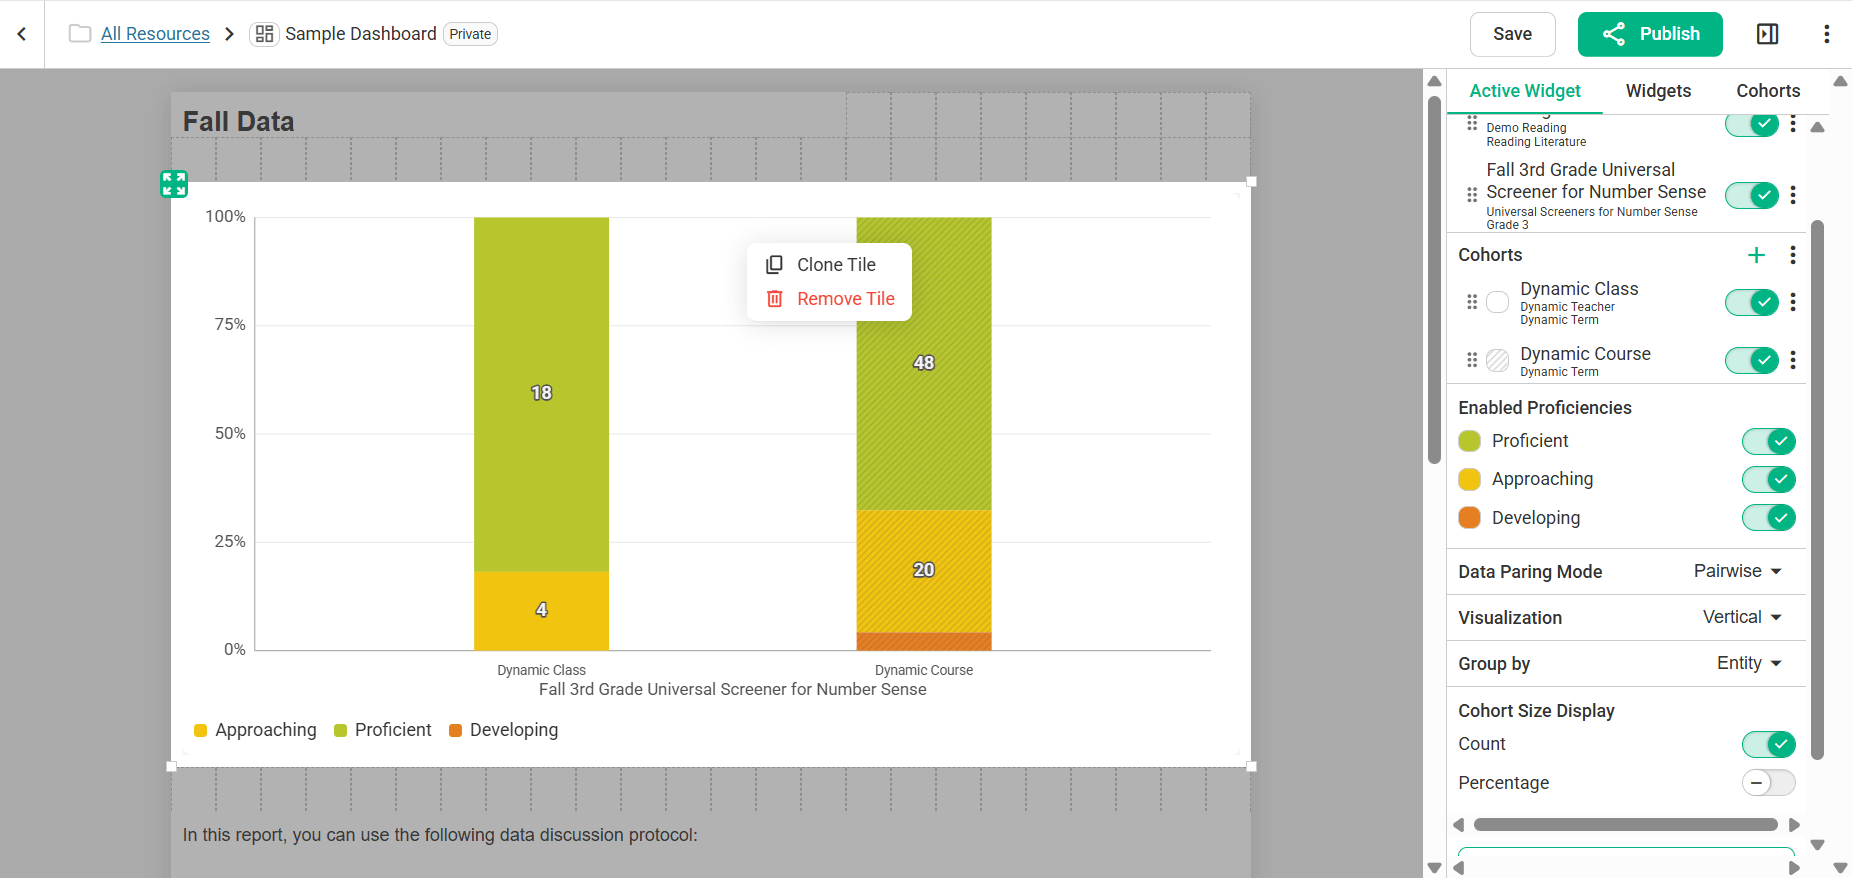
To rearrange the dashboard, drag tiles by their handles. Right-click any tile to Clone Tile or Remove Tile. Cloning is a quick way to reuse a report’s setup. For example, clone a Stacked Bar tile and switch the copy to Question Analysis to see both views side by side. To deselect a tile, click Close Settings.
Step 10: Save and publish
Click Save often while you work.
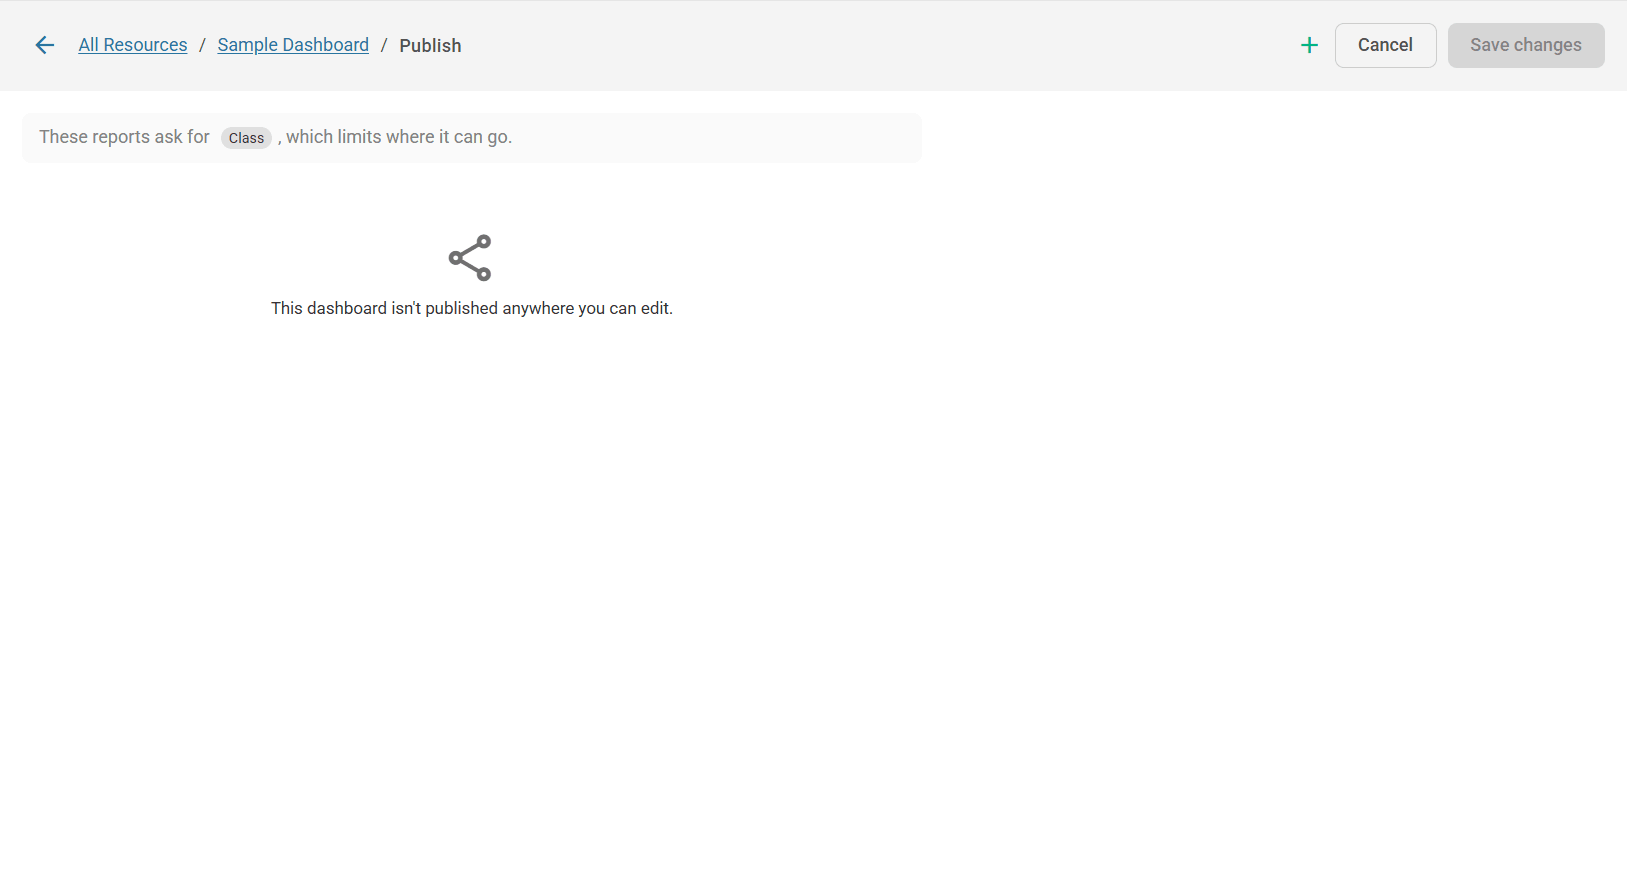
When the dashboard is ready, click Publish in the top-right corner. The Publish page opens.
If the dashboard uses dynamic cohorts, a note at the top shows what the reports need, for example: “These reports ask for Class, which limits where it can go.” A dashboard built on a Dynamic Class can only be published where a class is available to fill it in, such as the Class Dashboard page. The same goes for Dynamic School and other dynamic cohorts.
Click + in the top-right corner to add a place to publish the dashboard.
Click Save changes.
If the page says “This dashboard isn’t published anywhere you can edit,” the dashboard hasn’t been published to any location yet. Click + to add one. For everything the Publish page can do, see Publishing Dashboards.
Sharing dashboards
If a dashboard is set to Public, you can copy its link from the Resources folder and send it to others. People can view it through the link even if they don’t have the usual access permissions.
Where a dashboard appears
A dashboard no longer has a “type” you choose when you create it. You build the dashboard first, then decide where it should appear by publishing it, and the same dashboard can appear in several places at once.
There are four:
District: the district Dashboards page, for district leaders.
School: each school’s Dashboards page, for building leaders. Use the Dynamic School Cohort so each school sees its own data.
Class: each class’s Dashboards page, for teachers. Use the Dynamic Class Cohort so each class sees its own.
Student: a student’s Dashboards tab. Use the Dynamic Student Cohort.
Publishing is also no longer limited to district leaders: building leaders can publish to the schools they administer, and teachers to the classes they teach.
Course and School Course dashboards have been retired. A dashboard that used to be one of those is now simply a District or School dashboard. To reach particular courses, publish it to a Class place and name the courses there.
For the full rules, see Publishing Dashboards: narrowing by school, course, class or cohort, why a place might be unavailable, and what happens when two people publish the same dashboard.